
Answers now, not later
Vklass analys gives school authorities, principals and student health teams ready-made reports with built-in comparisons, so the question “compared with what?” has an answer for every figure. The reports use data the school already has in Vklass, and nobody needs to export anything to a spreadsheet.
- No new data collection
- No student risk scores
- Role-based access
 The answer to “compared with what?” is built in
Everyone sees their part
A film of just under six minutes shows Vklass analys in practice: more than forty ready-made reports and how the school authority, principals, student health, mentors and subject teachers each use their part. In a typical BI system, the reports reach only a few.
The film is just under six minutes long and has a Swedish voice-over. Swedish captions can be turned on in the player.
The figures in the spreadsheet are out of date before the board has read them
Systematic quality management should use current data. In practice, absence, assessments and grades are exported to spreadsheets that are out of date before the board sees them. Every comparison with national values or the previous year is built by hand, once a term.
When a question arrives from the board, the Swedish Schools Inspectorate or a principal, the work starts again: another export, new charts and new errors. Vklass analys reverses the order. Reports are ready with built-in comparisons and are updated every day, and the same figure means the same thing to school authorities, principals and teachers.

Different roles ask different questions
The reports are role-based: school authorities, principals and student health teams see different views, built around their respective assignments. Start where your question starts.
For school authorities and administration
“How do our schools compare, and is education equitable?”
- Quality management and benchmarks with your history against national values, SALSA and Kolada
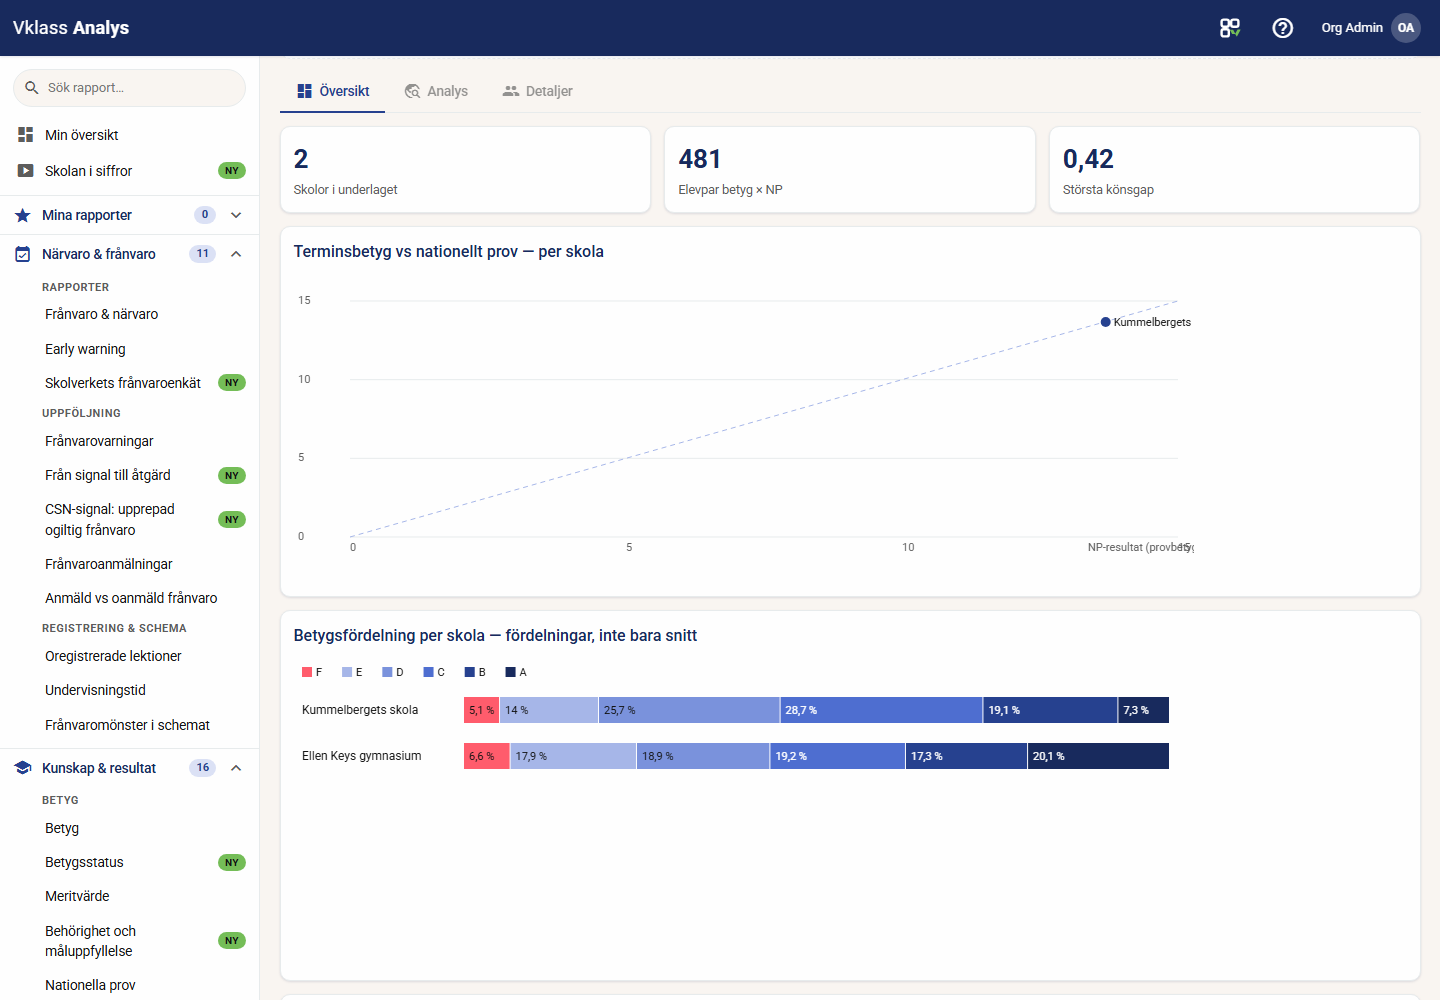
- Equity: grades against national tests, gender gaps and differences between units
- Comparative attendance statistics with schools side by side, the municipality's total absence per term and the Skolverket absence survey ready-made
- Student numbers and placements: students per school, year group and home municipality on the measuring day, plus children per preschool and department
For principals
“What do I need to act on this week?”
- Role-based overview that shows the situation in 30 seconds, with deviations first
- Absence and attendance: patterns by class, the students behind every figure and unregistered lessons
- Grades from F to A per subject, class and teacher, with Find students by grade
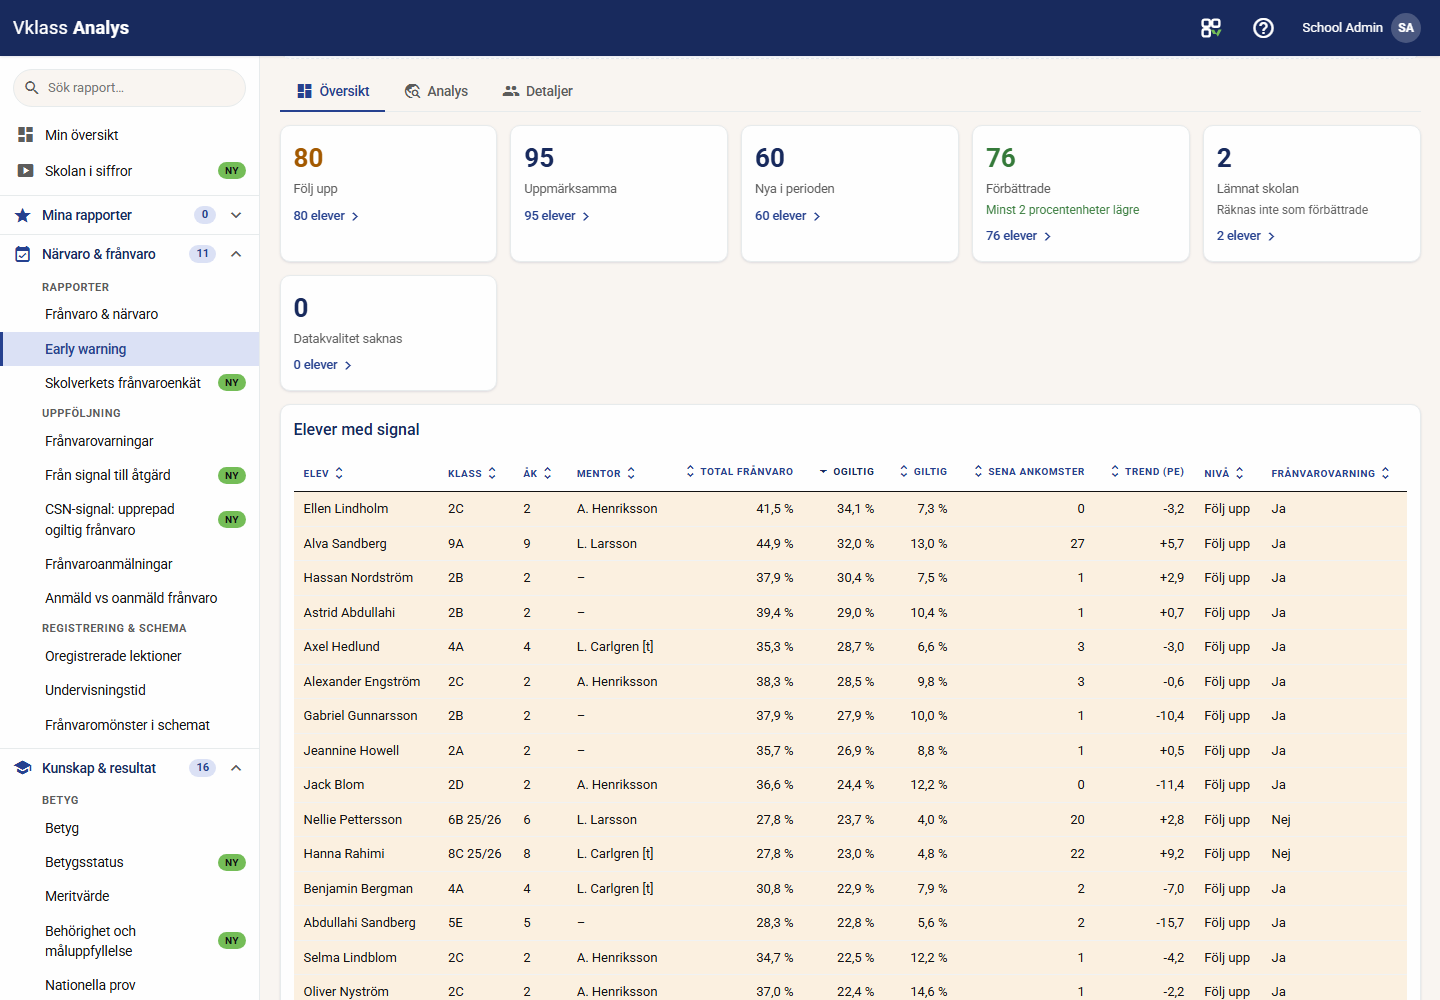
- Early warning with signals based on open rules, presented as a working list
- From signal to action: absence cases from threshold to evaluation, following the Education Act
For student health teams
“Which students need us before it appears in their grades?”
- Early warning with early signals from attendance and outcomes, which the student never sees
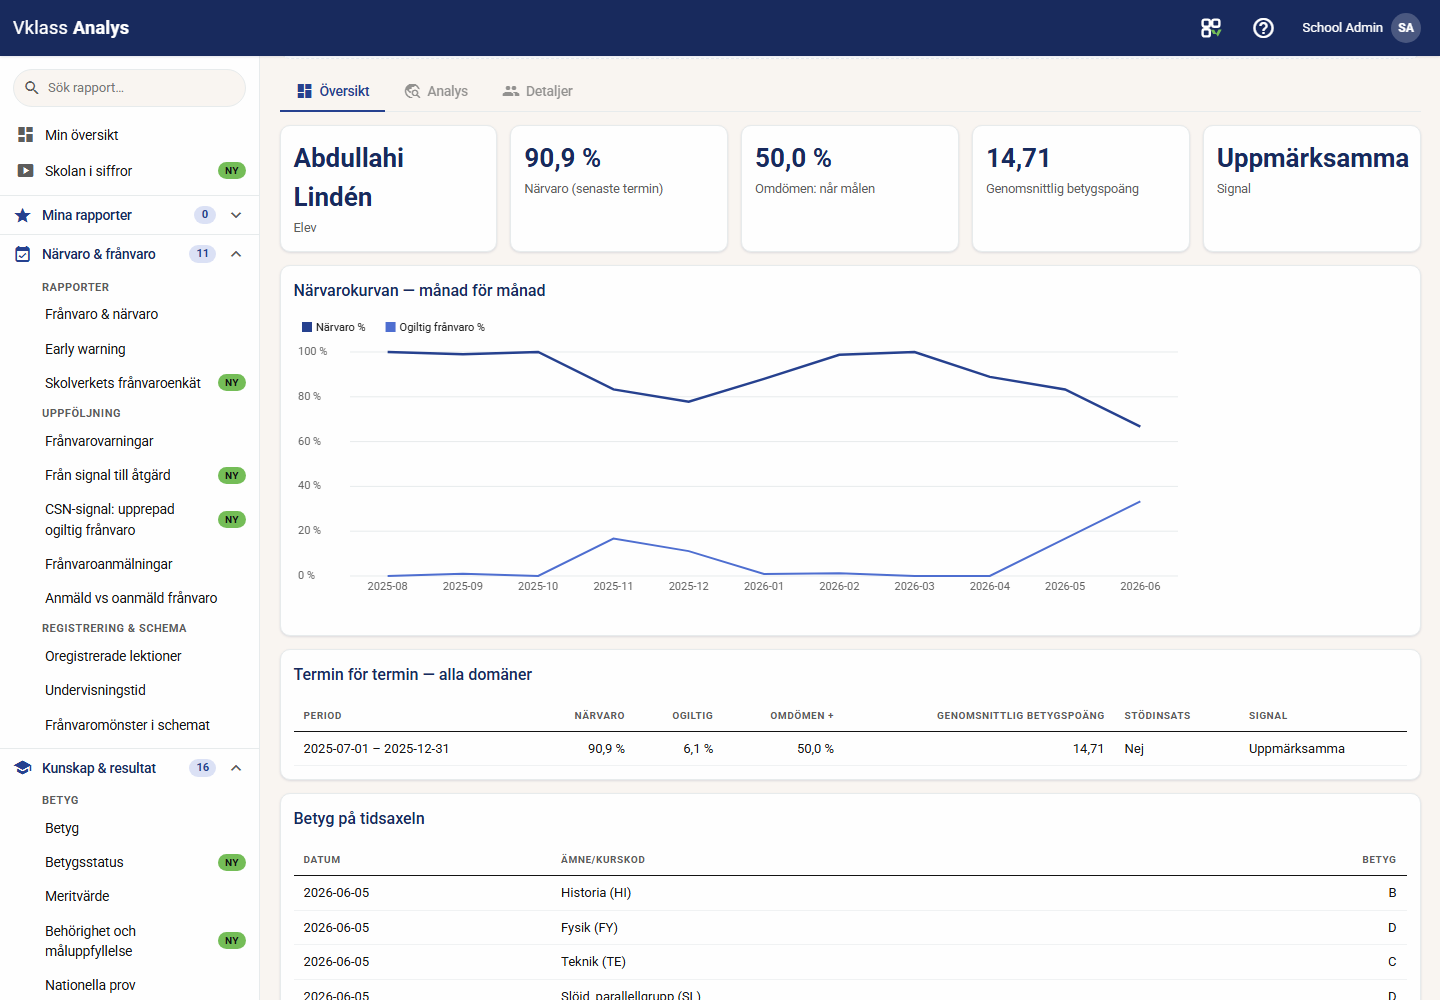
- Student journey: attendance, assessments and support on a timeline for professionals
- Support measures and action programs: volumes and follow-up (free text is never shown)
Built for Swedish schools from the ground up
Built-in comparison
Official statistics by school unit, national values, SALSA and Kolada are retrieved as open data and shown directly in the report. You do not need to export anything to a spreadsheet, and “compared with what?” is answered before it is asked.
Absence patterns in the timetable
The report shows absence against scheduled lesson time by weekday, time block, teacher and room. It requires timetable and attendance data in the same source system, and in Vklass they are.
Early warning without black boxes
The signals follow open rules that your school authority configures. The analysis does not calculate student risk scores with machine learning, and you can read, question and change every rule that raises a signal.
Equity as a ready-made report
Grades against national tests by group, gender gaps and the distributions behind the averages appear together with the School survey's safety and study environment. The report answers the Schools Inspectorate's first question.
Results follow-up
Custom absence periods and subject results appear on the same student row. The report also shows class curves by gender, attendance against merit value and national tests against assessments in year 3. Original values and coverage remain visible.
Student journey
The student's attendance, assessments, grades and support measures appear on a timeline for professionals and never become a label on the student.
From insight to timetable
A finding in Analys becomes input for Vklass schema, so analysis and action stay in the same product family.
Figures you can defend to the board and the Schools Inspectorate
Vklass analys uses data the school already has in Vklass. Nothing new is collected and nothing is shared with third parties. Every signal follows an open rule that your school authority configures, and no hidden model is used. Permissions decide the student level: the principal sees their school, the mentor their students and the teacher their groups, by name within their permissions. Flags are never shown to students or guardians. We prefer a distribution to an average, and the tool warns when an aggregate contradicts the units behind it. Small groups are suppressed only in comparisons outside your own permissions, for sensitive background variables, on maps and in surveys. Every opened student list and every export is logged. Values suppressed in official open data remain suppressed when shown by us.
Open rules
Every signal can be read, explained and configured. There are no hidden models.
Role-based access
The principal sees their school, the mentor their students and the teacher their groups, by name within their permissions. Every figure opens the students behind it, and every opened student list is logged.
No new data collection
The analysis uses what is already in Vklass, and nothing new is collected about students.
Built for the quality-management cycle
The reports follow the rhythm of quality work: current situation, comparison and follow-up. They also follow the national quality system, with its sub-goals and indicators mapped in advance.
School authorities gain access to the same kind of insight that an in-house BI or reporting solution would give, without the cost and time of building one from scratch. Such a build normally takes several months of development and a spend in the millions before the first report is ready.
The research behind our early-warning signals
The most accurate early-warning systems in education research are remarkably simple. Chicago's on-track indicator and the Balfanz ABC model (Attendance, Behavior, Course performance) use open thresholds for attendance and academic outcomes, and compare well with much more complex models. Vklass therefore chose not to use machine-learned risk scores: the school must be able to explain every flag to a guardian, and the school authority must be able to take responsibility for the rules.
When the Agency invites you to a quality dialogue, the current picture is ready
The Swedish National Agency for Education defines sub-goals and indicators by school form, and its quality dialogues start from them. Vklass analys maps the complete indicator picture: national statistics, the School survey and your local follow-up in one view.
- Mapped by school form The Agency's sub-goals and indicators are shown with your official values against national values and a three-school-year trend, from the same open data used for the dialogues.
- See today's situation, not last school year's Current equivalents from your own Vklass data always come with a definition note. They complement official statistics and never replace them.
- The material in one click Export material for the quality dialogue and the board, print-friendly and based on the Agency's template, with CSV for full traceability.

Book a demo and see the indicators for your school form See an example of the dialogue material (PDF in Swedish)
The example comes from the product and uses fictional demo data, just like the screenshots on this site.
Take the figures to the board as a PDF or a film
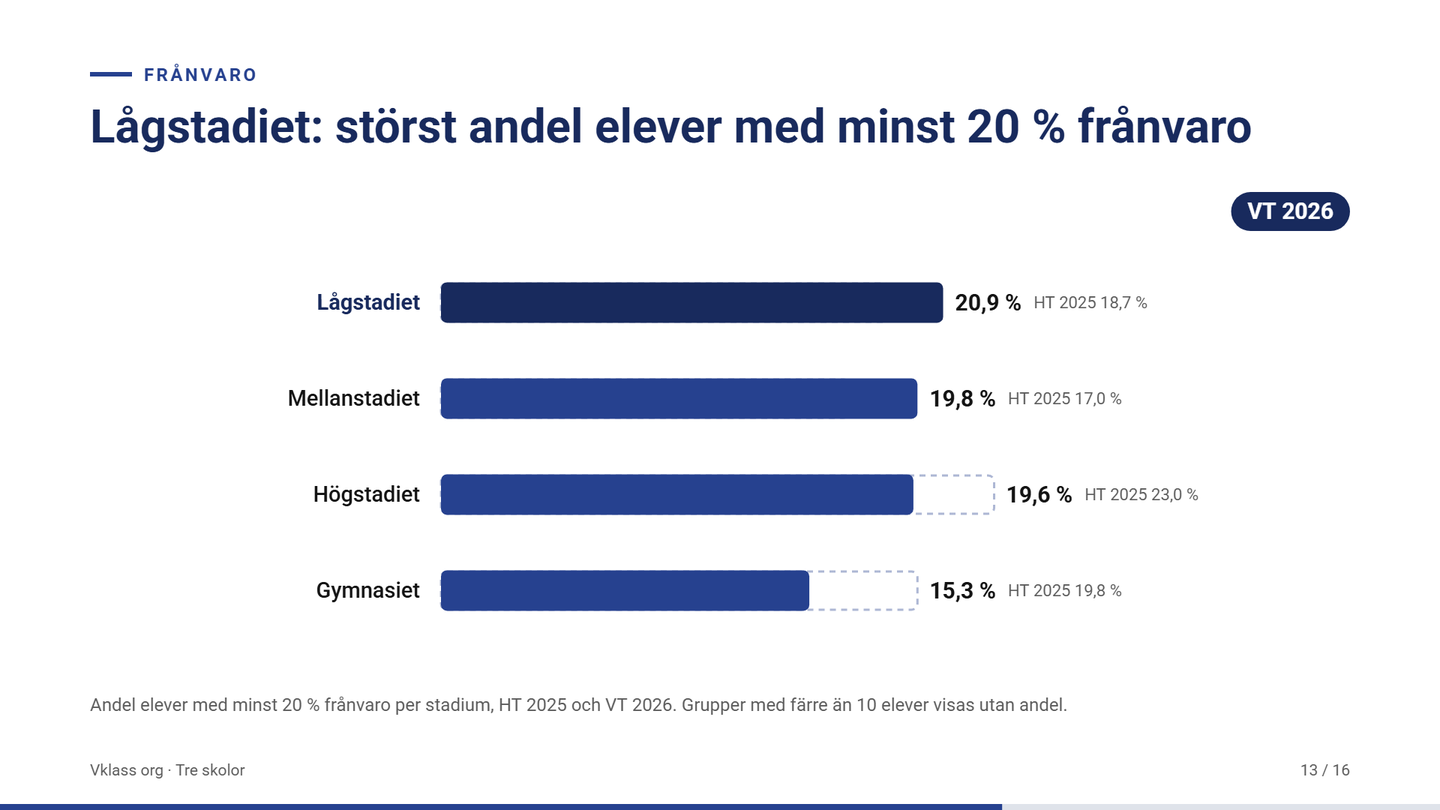
A report in the tool reaches those who sign in. Ready-made reports reach the rest: the education board, the management team and the staff meeting. They show the same figures and conclusions as the tool, in your own graphic profile.

Ready-made reports as PDF
Book a demo and see a show with your school form
Ready-made reports and shows are included from Insight. The show of absence is included in Basic. Students are never shown one by one: shares are not printed for groups with fewer than ten students.
You already have Power BI, but this is not the same thing
Building your own BI solution for school data is rational for the data platform as a whole. But student-level school analytics is the most expensive and sensitive sub-project: student-level permissions, statistical rules, external benchmarks and permanent management. It is a development project before the first report is usable, and a maintenance cost every school year after that.
Vklass analys feeds your data platform instead of competing with it. The school's reports are ready from the first day, while raw data is supplied through a REST API with more than 40 ready-made BI extracts in JSON or CSV format and support for SS 12000. The full comparison, with time, cost, responsibility and the category table, has its own page.
The reports waiting for you
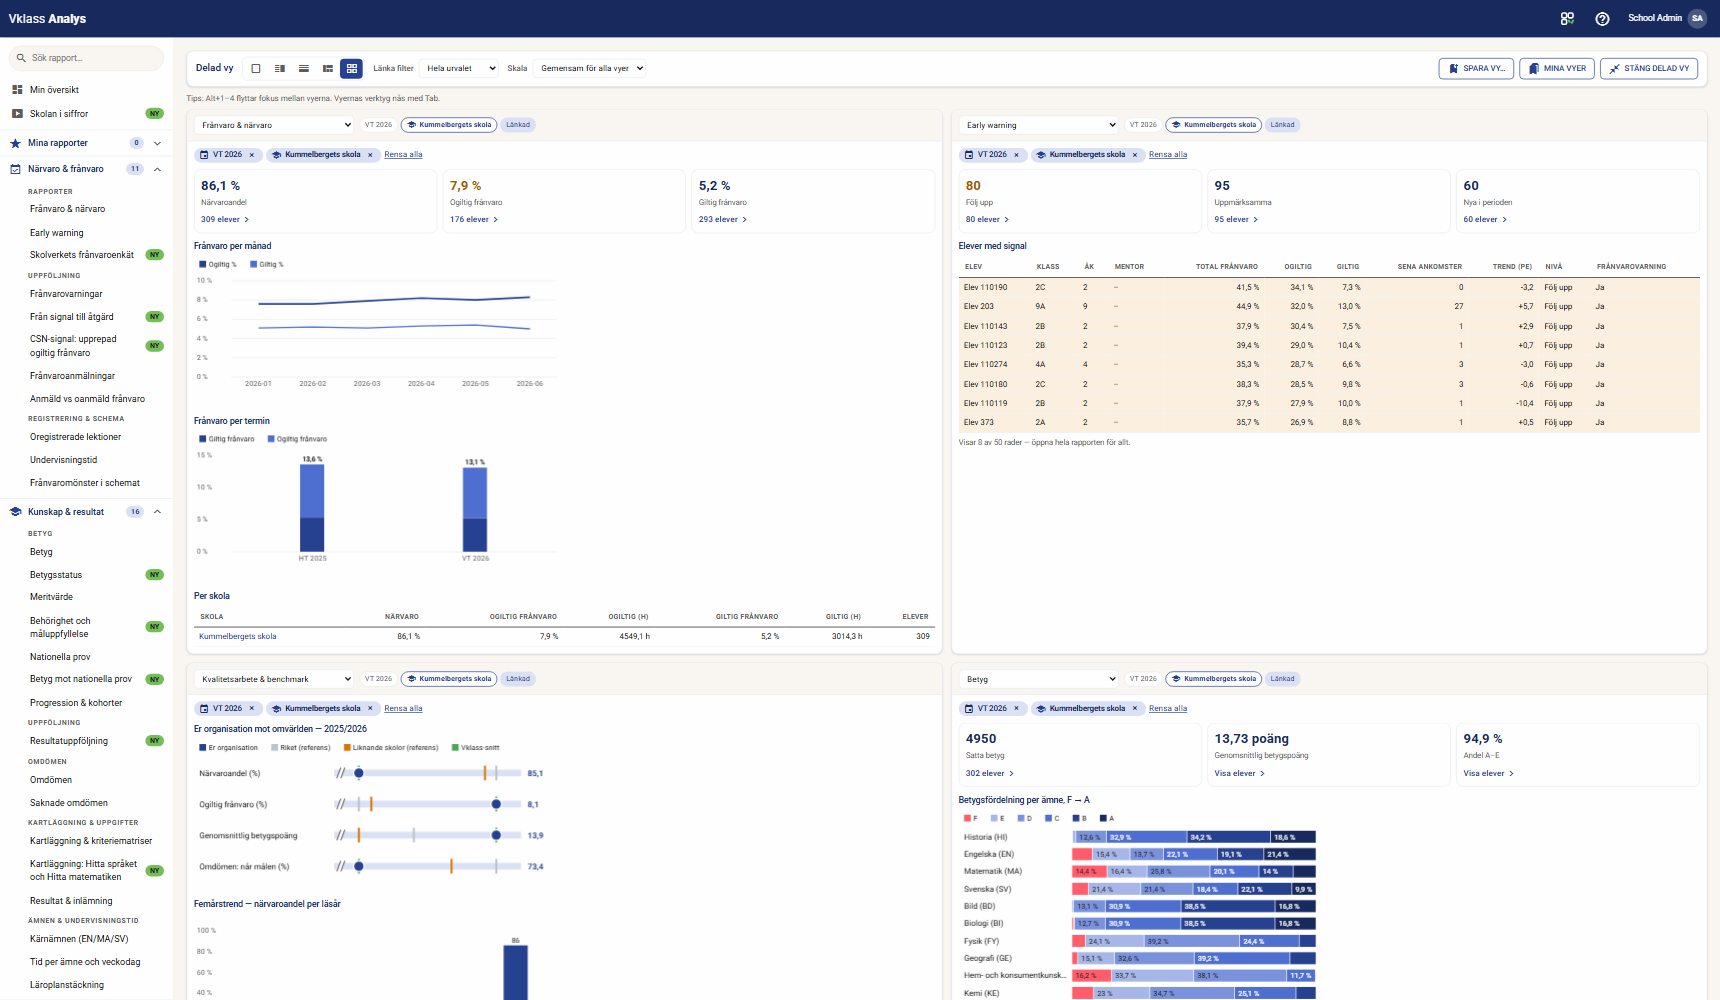
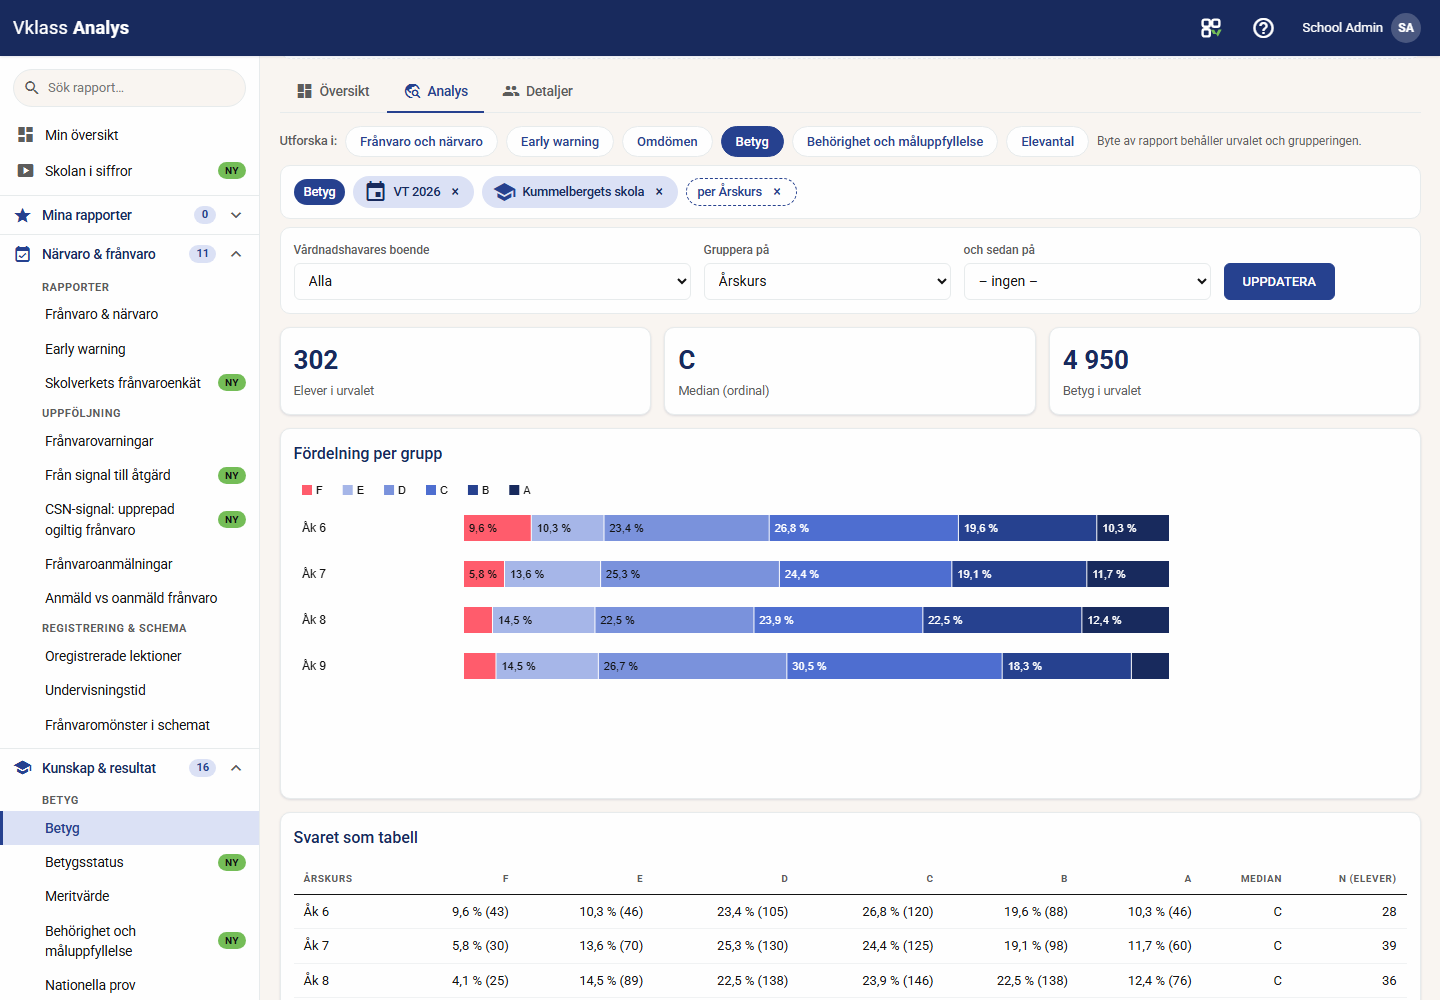
These are real screenshots from Vklass analys, with fictional demo data.
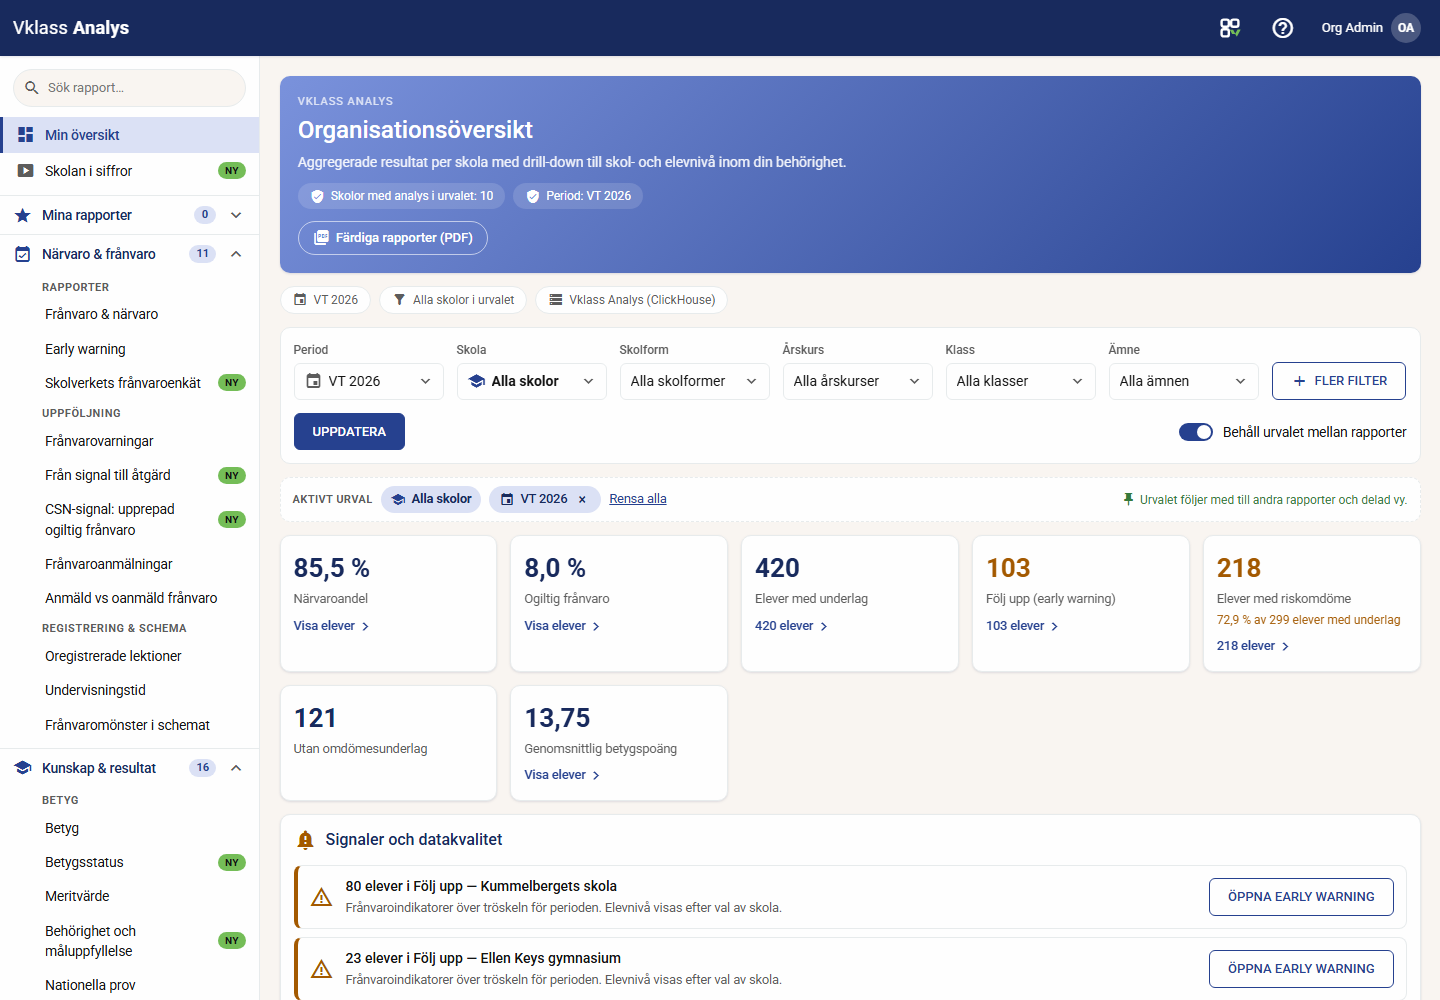
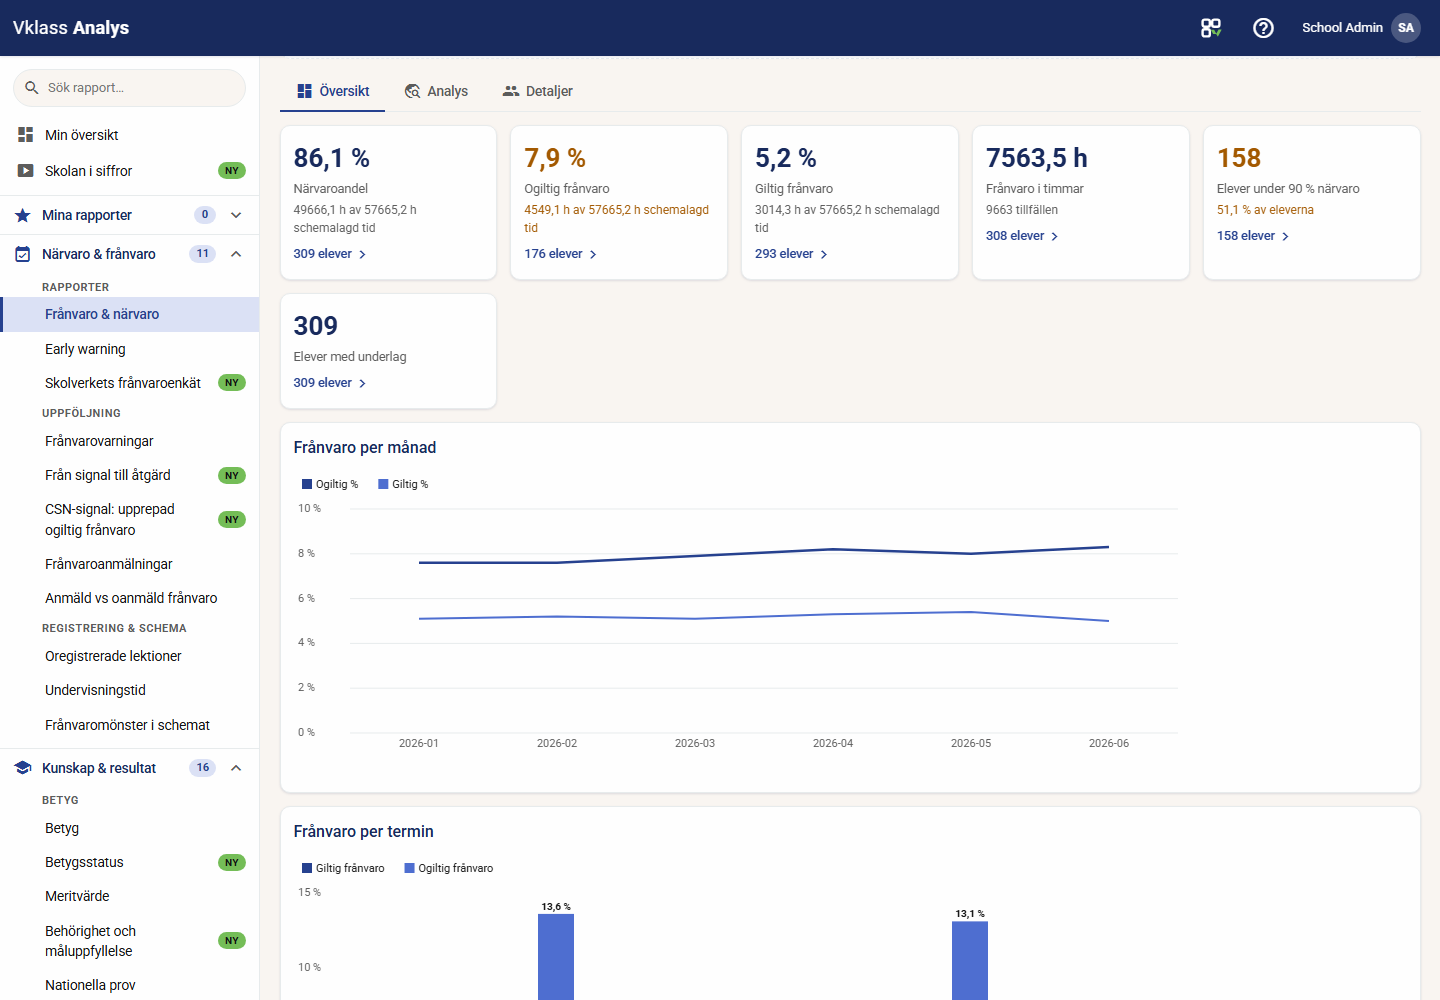
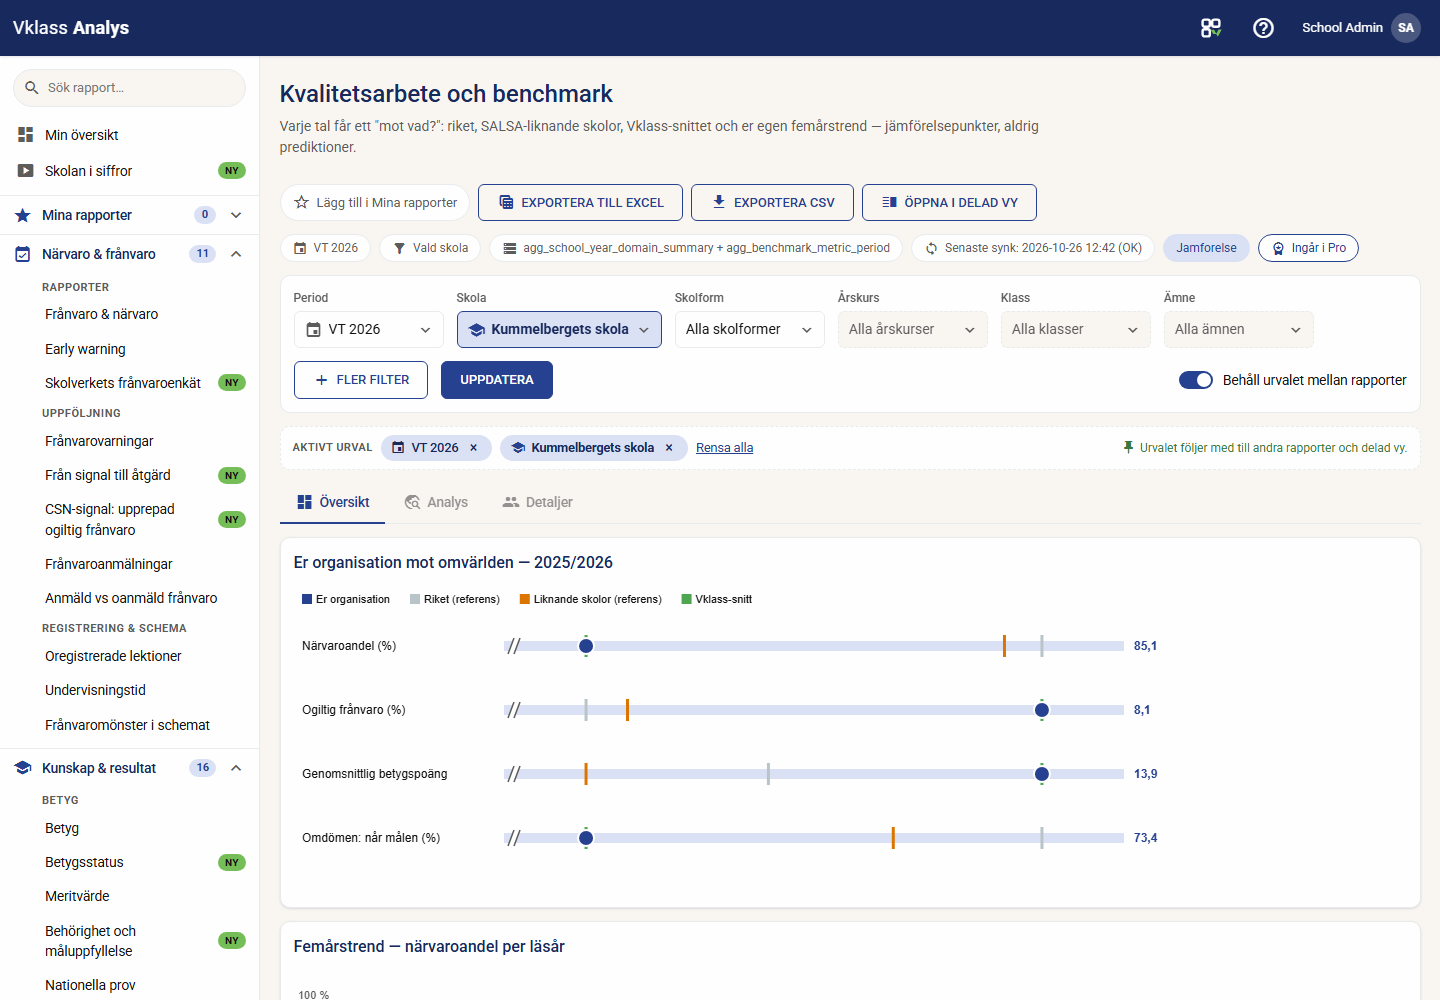
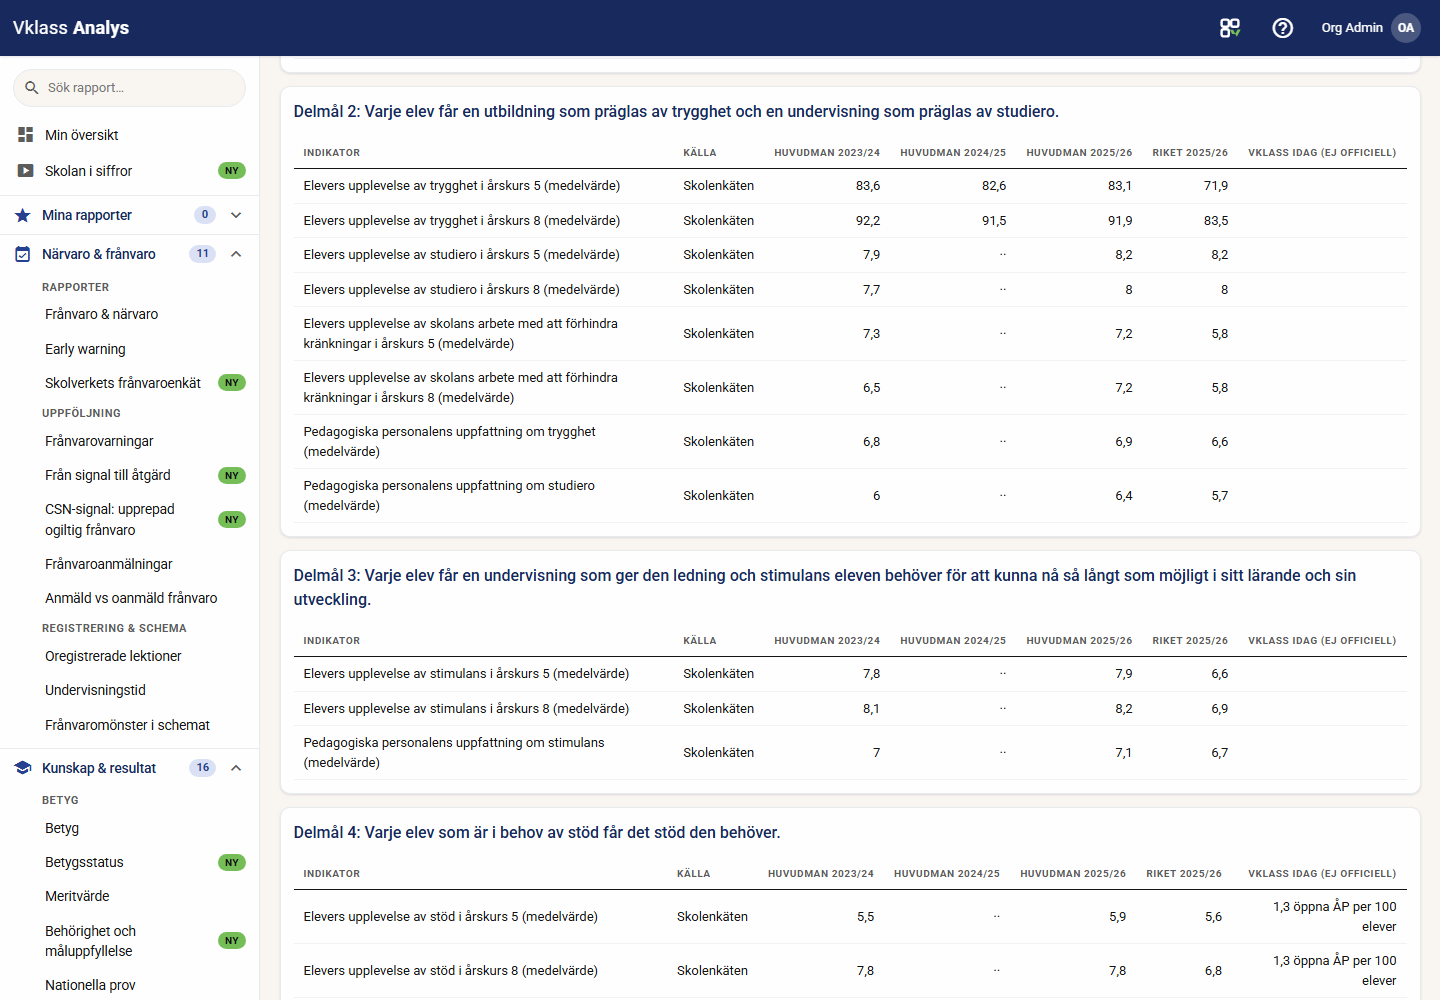
Built on the platform more than 3,000 schools work in
Vklass analys builds on the platform Swedish schools have used since 2007. The reports are designed together with school authorities, principals and quality managers who carry out systematic quality management in practice.
Timetables, absence and analytics are often procured together
Vklass analys is part of a family of services that share source data, sign-in and operations. Use them together or separately.
Vklass schema
Timetabling for the whole school year with automated generation, error checking and publication to teachers, students and guardians. Read more on the product site.
Vklass absence
Attendance and absence linked directly to scheduled lessons: teachers register attendance in the lesson, guardians report absence in the app, and the school follows patterns before they become problems.
Vklass analys
This product: statistics and analytics for schools and school authorities with comparisons built in. Absence, learning outcomes, equity, student health, student numbers and operations are in one tool.
Vklass and the app
The platform that has brought daily school life together since 2007, with an app for teachers, students and guardians. Read more at vklass.com.
What most people want to know
Can we get the reports as a PDF or a film for the board?
Yes. Ready-made reports are saved as PDF with a cover, chapters and conclusions in your own graphic profile. Every report can also be played as a show, an animated story of one to two minutes, and downloaded as MP4. The figures and the conclusions are the same as in the tool.
Can students or guardians see their flags?
No, never. Early-warning signals are shown only to authorized staff. Students and guardians instead see a transparency page explaining which data is used and how.
Do you use machine learning to calculate student risk scores?
No. Every signal follows an open threshold rule that your school authority can read and configure. There is no machine-learned weighting and there are no hidden models. Research shows that open rules compare well with complex models.
Does Vklass analys require new data collection about students?
No. The analysis uses only data the school already has in Vklass: attendance, assessments, grades and support measures. Nothing new is collected and nothing is shared with third parties.
What do you compare against?
We compare against official statistics by school unit, national values, SALSA and Kolada. The data is retrieved as open data and follows along when the sources are updated. The comparison is built into the reports and needs no separate project.
Can we export raw data to our own data platform?
Yes. Vklass has a REST API with more than 40 ready-made BI extracts in JSON or CSV format, together with support for SS 12000. From the reports, tables are exported as CSV and student lists to Excel. Every download is logged, and student-level exports are always traceable.
How are small groups protected in the statistics?
Permissions decide the student level. The principal sees their school, the mentor their students and the teacher their groups, by name within their permissions. Small groups are suppressed only in comparisons outside your own permissions, for sensitive background variables, on maps and in surveys. Every opened student list and every export is logged. Values suppressed by the Swedish National Agency for Education remain suppressed when shown by us.
Can we select several schools, year groups and subjects at once?
Yes. The filter bar at the top of every report has multi-select for school, year group, class, teaching group, subject and gender, quick picks for school year, term and month, and a custom date range. The selection follows you between reports, on reload and into split view, where the panes also share the same scale so two schools can be read against each other.
How often are the reports updated?
Every day. The reports are ready with built-in comparisons, and you need no exports, spreadsheets or implementation project.
Does the whole organization have to join at once?
No. Vklass analys is activated per school or for the whole organization. The source data is already in place if you use Vklass.
Are the reports from the earlier report module still available?
Yes. The reports under School admin › Reports have their counterparts in Basic: the municipality's total absence per term, absence per year group, subject, class and gender, students with high absence, assessments per year group and subject with coverage, the Skolverket absence survey and the mapping results per task. You now also see the students behind every figure within your permissions and can export to Excel.
What does Vklass analys cost?
The service has three levels: Basic in Vklass, Insight and Pro. The packages page describes what is included, and you receive a price example for your organization during the demo.
Does Vklass analys support the national quality system?
Yes. The Swedish National Agency for Education's sub-goals and indicators are mapped by school form, with your official values against national values and a three-school-year trend. National statistics, the School survey and local follow-up appear together. Read more in the section on the quality dialogue.
Can we prepare the material for the quality dialogue here?
Yes. The national quality system report exports the material for the quality dialogue in a print-friendly format, with a sub-goal overview, unit comparison and room for your own analysis, plus CSV for full traceability. The material uses only official values.
